Overview
Get a deeper understanding of your business performance by outlining your data in more manageable and optimized manner.
ZenConix’s Chart Board designer has transformed the way your business collects and analyzes the data. This Out-Of-Box Solution helps you in pipelining your plans with solid leads to increase productivity. The target is to improve the decision-making process by monitoring real time business data. It helps in visualizing company’s important data to monitor Key Performance Indicator (KPI) and Key Performance Results (KPR) to make sustainable decisions that helps in long term goal.
Targeted audience
Business owners and management authorities of any organization can use our chart board designer to visualize important metrices without any technical know-how
Features
- Suitable for startup and mid-scale enterprise.
- Fetch data from your SharePoint site and create charts within seconds
- Incorporate huge amount of data supported on SharePoint environment.
- Deployable on SharePoint Online, Standard and Enterprise version of SharePoint 2013 and above
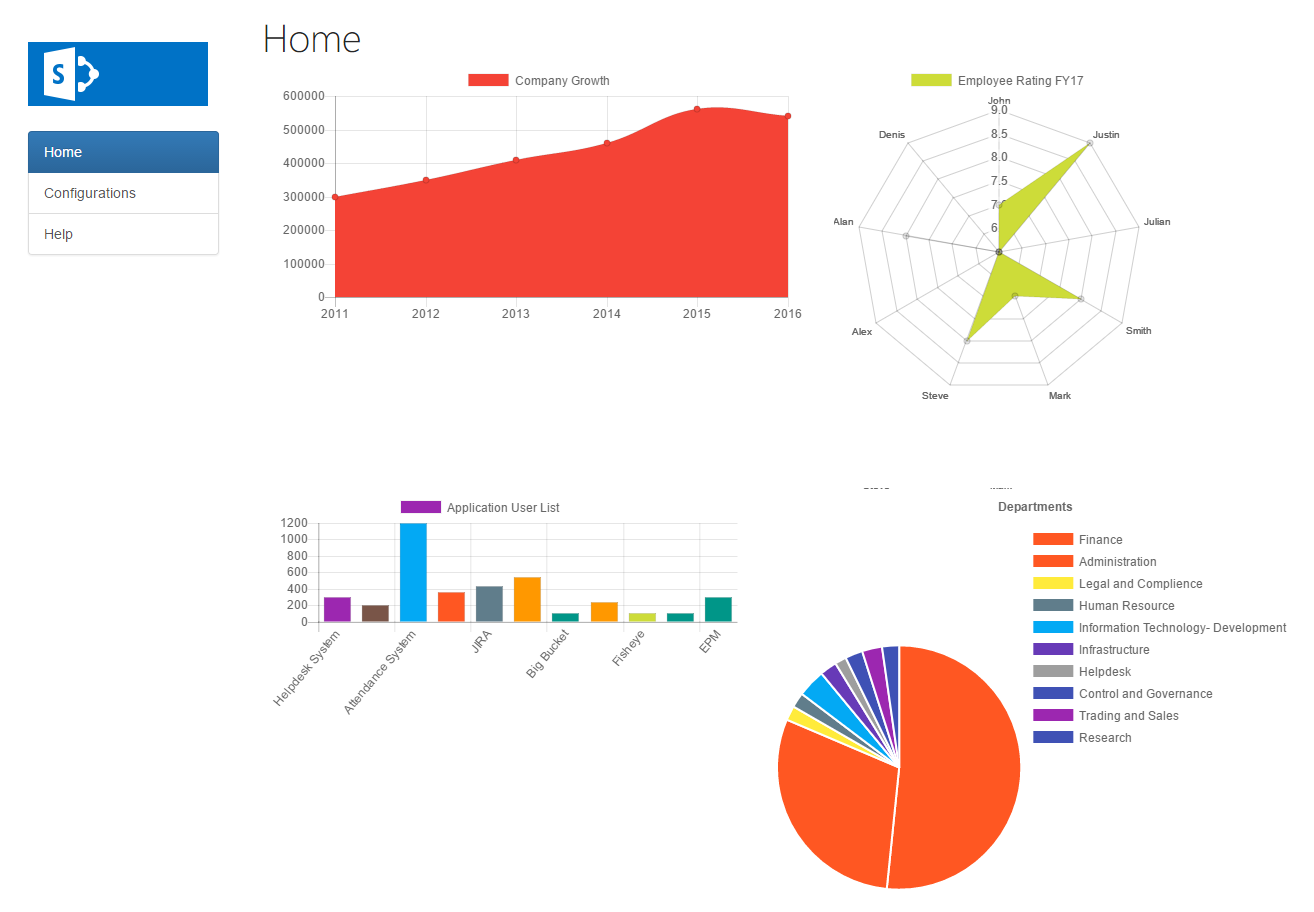
- Ability to choose charts according to user’s preference
- Pie Chart
- Bar Chart
- Radar Chart
- Line Chart
Do not wait for analyst. Visualize your real-time data and find new opportunities with our platform.
Features
You can create following charts in few clicks 1. Pie Chart 2. Bar Chart 3. Radar Chart 4. Line ChartSpecifications
This app can be installed on following SharePoint Versions 1. SharePoint Online 2. SharePoint 2013 3. SharePoint 2016Preview